Obviously with the results of the general election announced my mind turns to analysis and visualisation. I had/have been looking at this for a while, and here are my notes. Actually this is an index entry as much of what I had found is catalogued in the two related posts below/overleaf. …
The ONS offer tools visualising facts by constituency
I had another look at this in 2021. I have found the following links,
- https://open-innovations.org/blog/2017-05-08-mapping-election-with-hexes, an opening page at odileeds, mainly about why hexagons.
- https://odileeds.github.io/odi.hexmap.js/, they say, “This library assumes you have an existing hex layout as HexJSON (e.g. layouts we’ve made) and the ability to add Javascript to a webpage. The library creates an SVG (scalable vector graphic) of hexes – which can be styled via CSS – and some basic event callbacks.” This has a lot of example code, otherwise known by me as
ODI - Getting Started
- https://open-innovations.org/projects/hexmaps/ge2019/ this is the 2019 GE with popups on the constituencies,
ODI - 2029 GE thumbnail
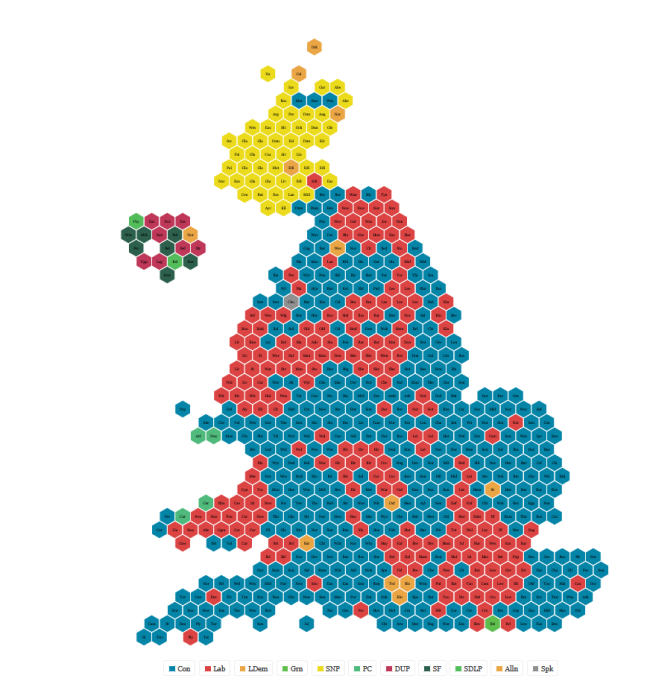
- https://open-innovations.org/blog/2017-05-08-mapping-election-with-hexes or how Leeds got there! They point at the hexmap of constituencies, and the code that does the 2015 and other results.
- https://github.com/jbaileyh/geogrid claims to be a tool that generates the cartograms from HexJson. It does and works from a .csv spreadsheet. I used this colour picker to get the colour hex codes.
- A document on HexJSON and how to write it.
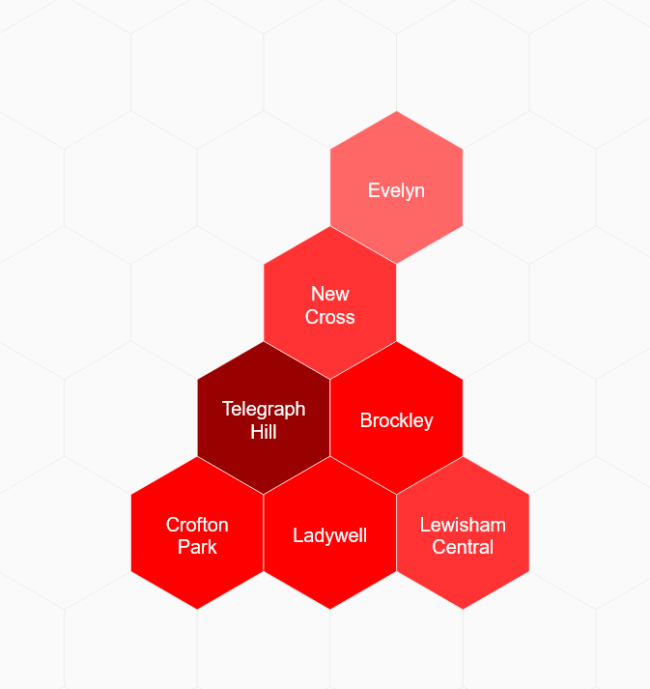
So I made a hexmap, it’s not finished yet.
- I started from here, where they publish code that almost works. I found this via the ODI page documenting the javascript.
- I used this page to generate the hexmap in json.
#hexmap1 { height: 300px; width: 100%; }
</style>
<script type="text/javascript"
src="https://odileeds.github.io/odi.hexmap.js/odi.hexmap.js">
</script>
<script>
ODI.ready(function(){
hex = new ODI.hexmap(document.getElementById('hexmap1'),{
'labels': { 'show': true },
'hexjson':{ "layout":"odd-r",
"hexes": {
"1":{"n":"Evelyn","id":1,"q":2,"r":3,"colour":"red","threat":"Tory"},
"2":{"n":"New Cross Gate","id":2,"q":2,"r":2,"colour":"#900","threat":"Tory"},
"3":{"n":"Deptford","id":3,"q":3,"r":2,"colour":"#900","threat":"Tory"},
"4":{"n":"Telegraph Hill","id":4,"q":1,"r":1,"colour":"#900","threat":"TUSC"},
"5":{"n":"Brockley","id":5,"q":2,"r":1,"colour":"#f66","threat":"Green Party"},
"6":{"n":"Crofton Park","id":6,"q":1,"r":0,"colour":"threat","pop":"Tory"},
"7":{"n":"Ladywell","id":7,"q":2,"r":0,"colour":"#f66","threat":"Tory"},
"8":{"n":"Lewisham Central","id":8,"q":3,"r":0,"colour":"#f66","threat:"Tory"}
} } }); }); </script>
<div id="hexmap1"></div>
I had to poke around the ODI pages to find the ODI.ready(function(){ rune, which I found inside the ODI javascript. They talk about a format function which I can’t quite get to work. Format is used if varying the SVG file, it uses tspan entity. I would like to offer a popup box rather than use this tool.
Related Posts
The latter link has the following links,
- Election hex mapping, at ODI Leeds.
- 2017 General Election hex map, at ODI Leeds.
One Comment