This is an omnibus article on data visualisation using maps. I went back to map visualisation solution in the autumn of 2014. This maps tag retrieves the the articles on this wiki. My current interests is in web hosted maps visualisations and thus in wordpress. I have also found this article, 10 Free Tools For Creating Your Own Maps. A couple of these look very interesting. UMapper and HeatMaps look rather fun. I have also experimented with Tableau Software’s public aka community release.
I installed two maps on this wiki, at testing interactive world map and testing ideal interactive map. They can be viewed at their requisite pages.
Further research pointed me at mapsmarker another wordpress plugin.
Here are some of my bookmarks,
[jp-rss-feed url=”http://feeds.delicious.com/v2/rss/davelevy/maps+webdesign” numitems=”7″ getdesc=”50″ ]
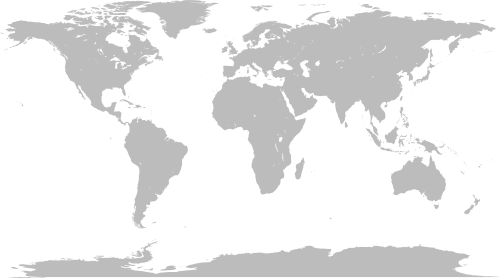
Here’s a commons world map,
This file is licensed under the Creative Commons Attribution-Share Alike 4.0 International, 3.0 Unported, 2.5 Generic, 2.0 Generic and 1.0 Generic license, copyright held by the Free Software Foundation. Originally found at here… Here is its 500px width .png version.
